Dynatrace helps development teams build, monitor and optimize applications efficiently.
Do you know why developers love Dynatrace? This solution helps development teams build and follow organizational best practices for observability and security without adding friction to the development process by providing developers with access to template libraries for reusable configurations. This blog will detail more about Dynatrace and how in conjunction with Atentus you can make the most of the functionalities.
Dynatrace is the name of the application monitoring tool that provides customers with accurate performance monitoring and reliable system availability. This solution seamlessly integrates infrastructure and cloud, application performance and digital experience monitoring in an all-in-one automated solution that works with artificial intelligence
In addition, the infrastructure is monitored. The program examines the server infrastructure, databases, and code to determine the root cause of any performance difficulties. Dynatrace seamlessly integrates infrastructure and cloud, application performance, and digital experience monitoring into an all-in-one automated solution powered by artificial intelligence.
The Dynatrace all-in-one platform was built with a variety of application scenarios in mind.
Infrastructure Monitoring: with the help of Dynatrace, you can automate and simplify infrastructure monitoring while getting a complete view of all your hosts, virtual machines, containers, networks, events, and logs. To help you simplify tools and reduce MTTI, Dynatrace automatically discovers your dynamic environment and collects infrastructure metrics.
Applications and microservices: applications running in complex enterprise cloud configurations can benefit from Dynatrace's automatic code-level visibility and root cause analysis. For transactions at each level, Dynatrace automatically records time and code level information.
Application Security: by using automatic runtime application vulnerability management that adapts to the cloud and Kubernetes, Dynatrace helps you deliver applications faster and more securely.
Monitoring the digital experience: Real-user monitoring (RUM) for each of your customers' trips, synthetic monitoring of the entire network, and playback of sessions that look like a 4K movie are all features of Dynatrace DEM. This powerful combination allows you to improve the user experience, optimize your applications and provide first-class support across all digital channels.
Automation in the cloud: automatically receive accurate answers from Dynatrace AIOps. To enable fast automatic correction and intelligent cloud organization, Dynatrace collects high-fidelity data in real time. In addition, it maps dependencies so that Davis, Dynatrace's explainable AI engine, can show you the specific root causes of problems or anomalies.
Here are the key concepts to understand how it works:
OneAgent Services: applications, microservices, infrastructure, and other dependencies in contemporary cloud systems are automatically discovered, activated, and instrumented.
PurePath distributed tracking: captures and examines time and context at the code level for all traces distributed across the stack, from start to finish.
Smartscape Topology: mapping dynamic interactions between all components at all levels using the structure of the environment.
Grail data lakehouse: Massive parallel processing analysis engine for causal data lakehouses that uses Dynatrace Query Language for rapid, context-rich, AI-driven analyses.
Davis's causal AI engine: analyzes all connections and dependencies within complicated IT configurations to provide accurate solutions that are classified according to business effect. Davis notifies you when a problem arises, its effects on the business and its underlying causes so that it can be addressed immediately.
Compared to other monitoring tools, Dynatrace takes a very different approach. The four main distinctions are as follows:
Automatic: Dynatrace performs all operations automatically, including implementation, instrumentation, discovery, dependency mapping, baseline, problem identification, and root cause analysis.
Full Stack: It provides context, while other systems track and report on multiple metrics. From the end user experience to infrastructure, this involves understanding and mapping every relationship and interdependence.
Web scale: The cloud-native architecture used in building the software intelligence platform allows for infinite scale.
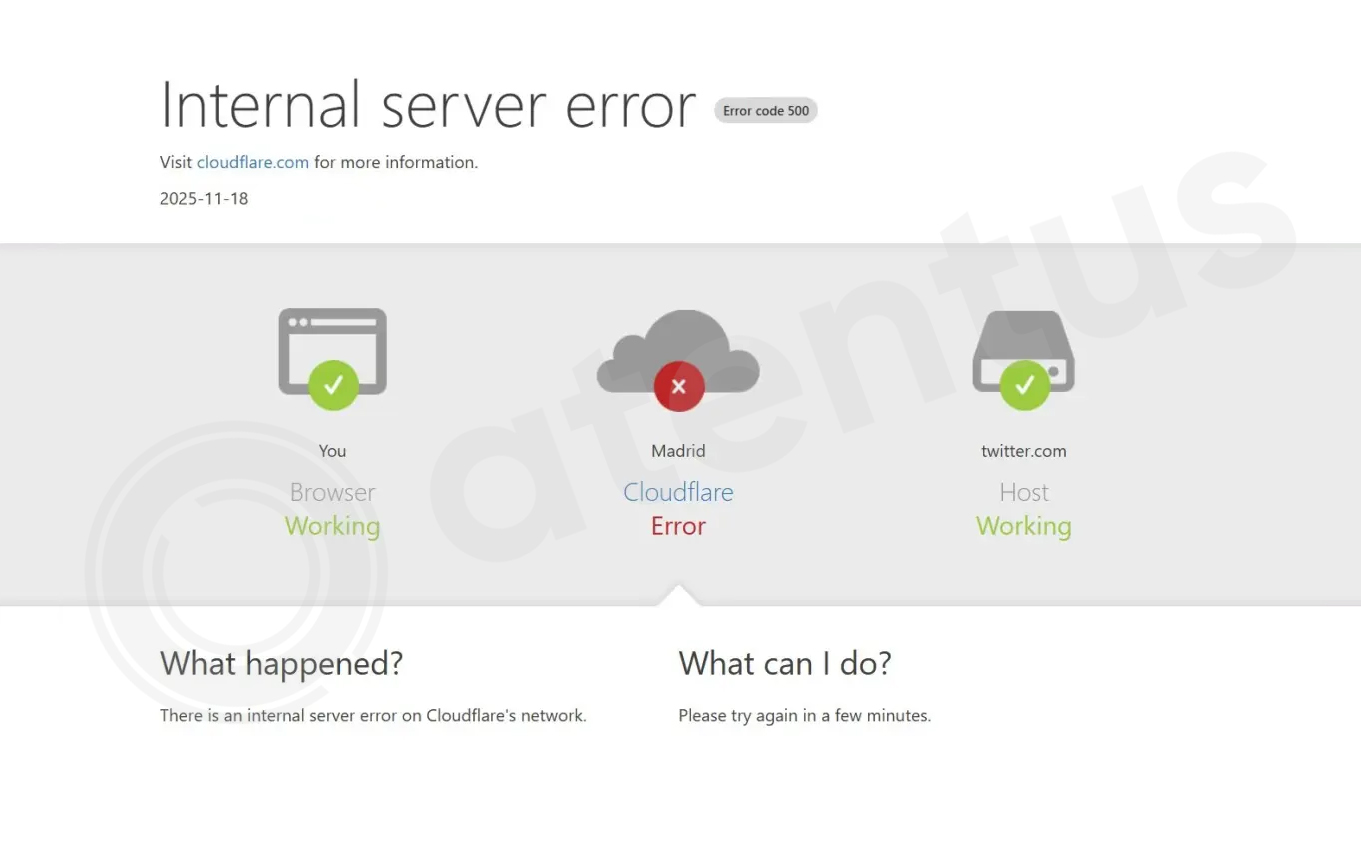
You should have a large amount of data available for testing and you should be able to evaluate the state of your system using tools such as CPU, memory, disk, network usage, and storage issues.
You can also investigate the problems that the above-mentioned solution has identified.
It allows programmers and testers to ensure the efficiency and reliability of their applications.
Before the customer complains, problems can be identified.
According to the website of the mentioned company, the price varies depending on the service and capacity.
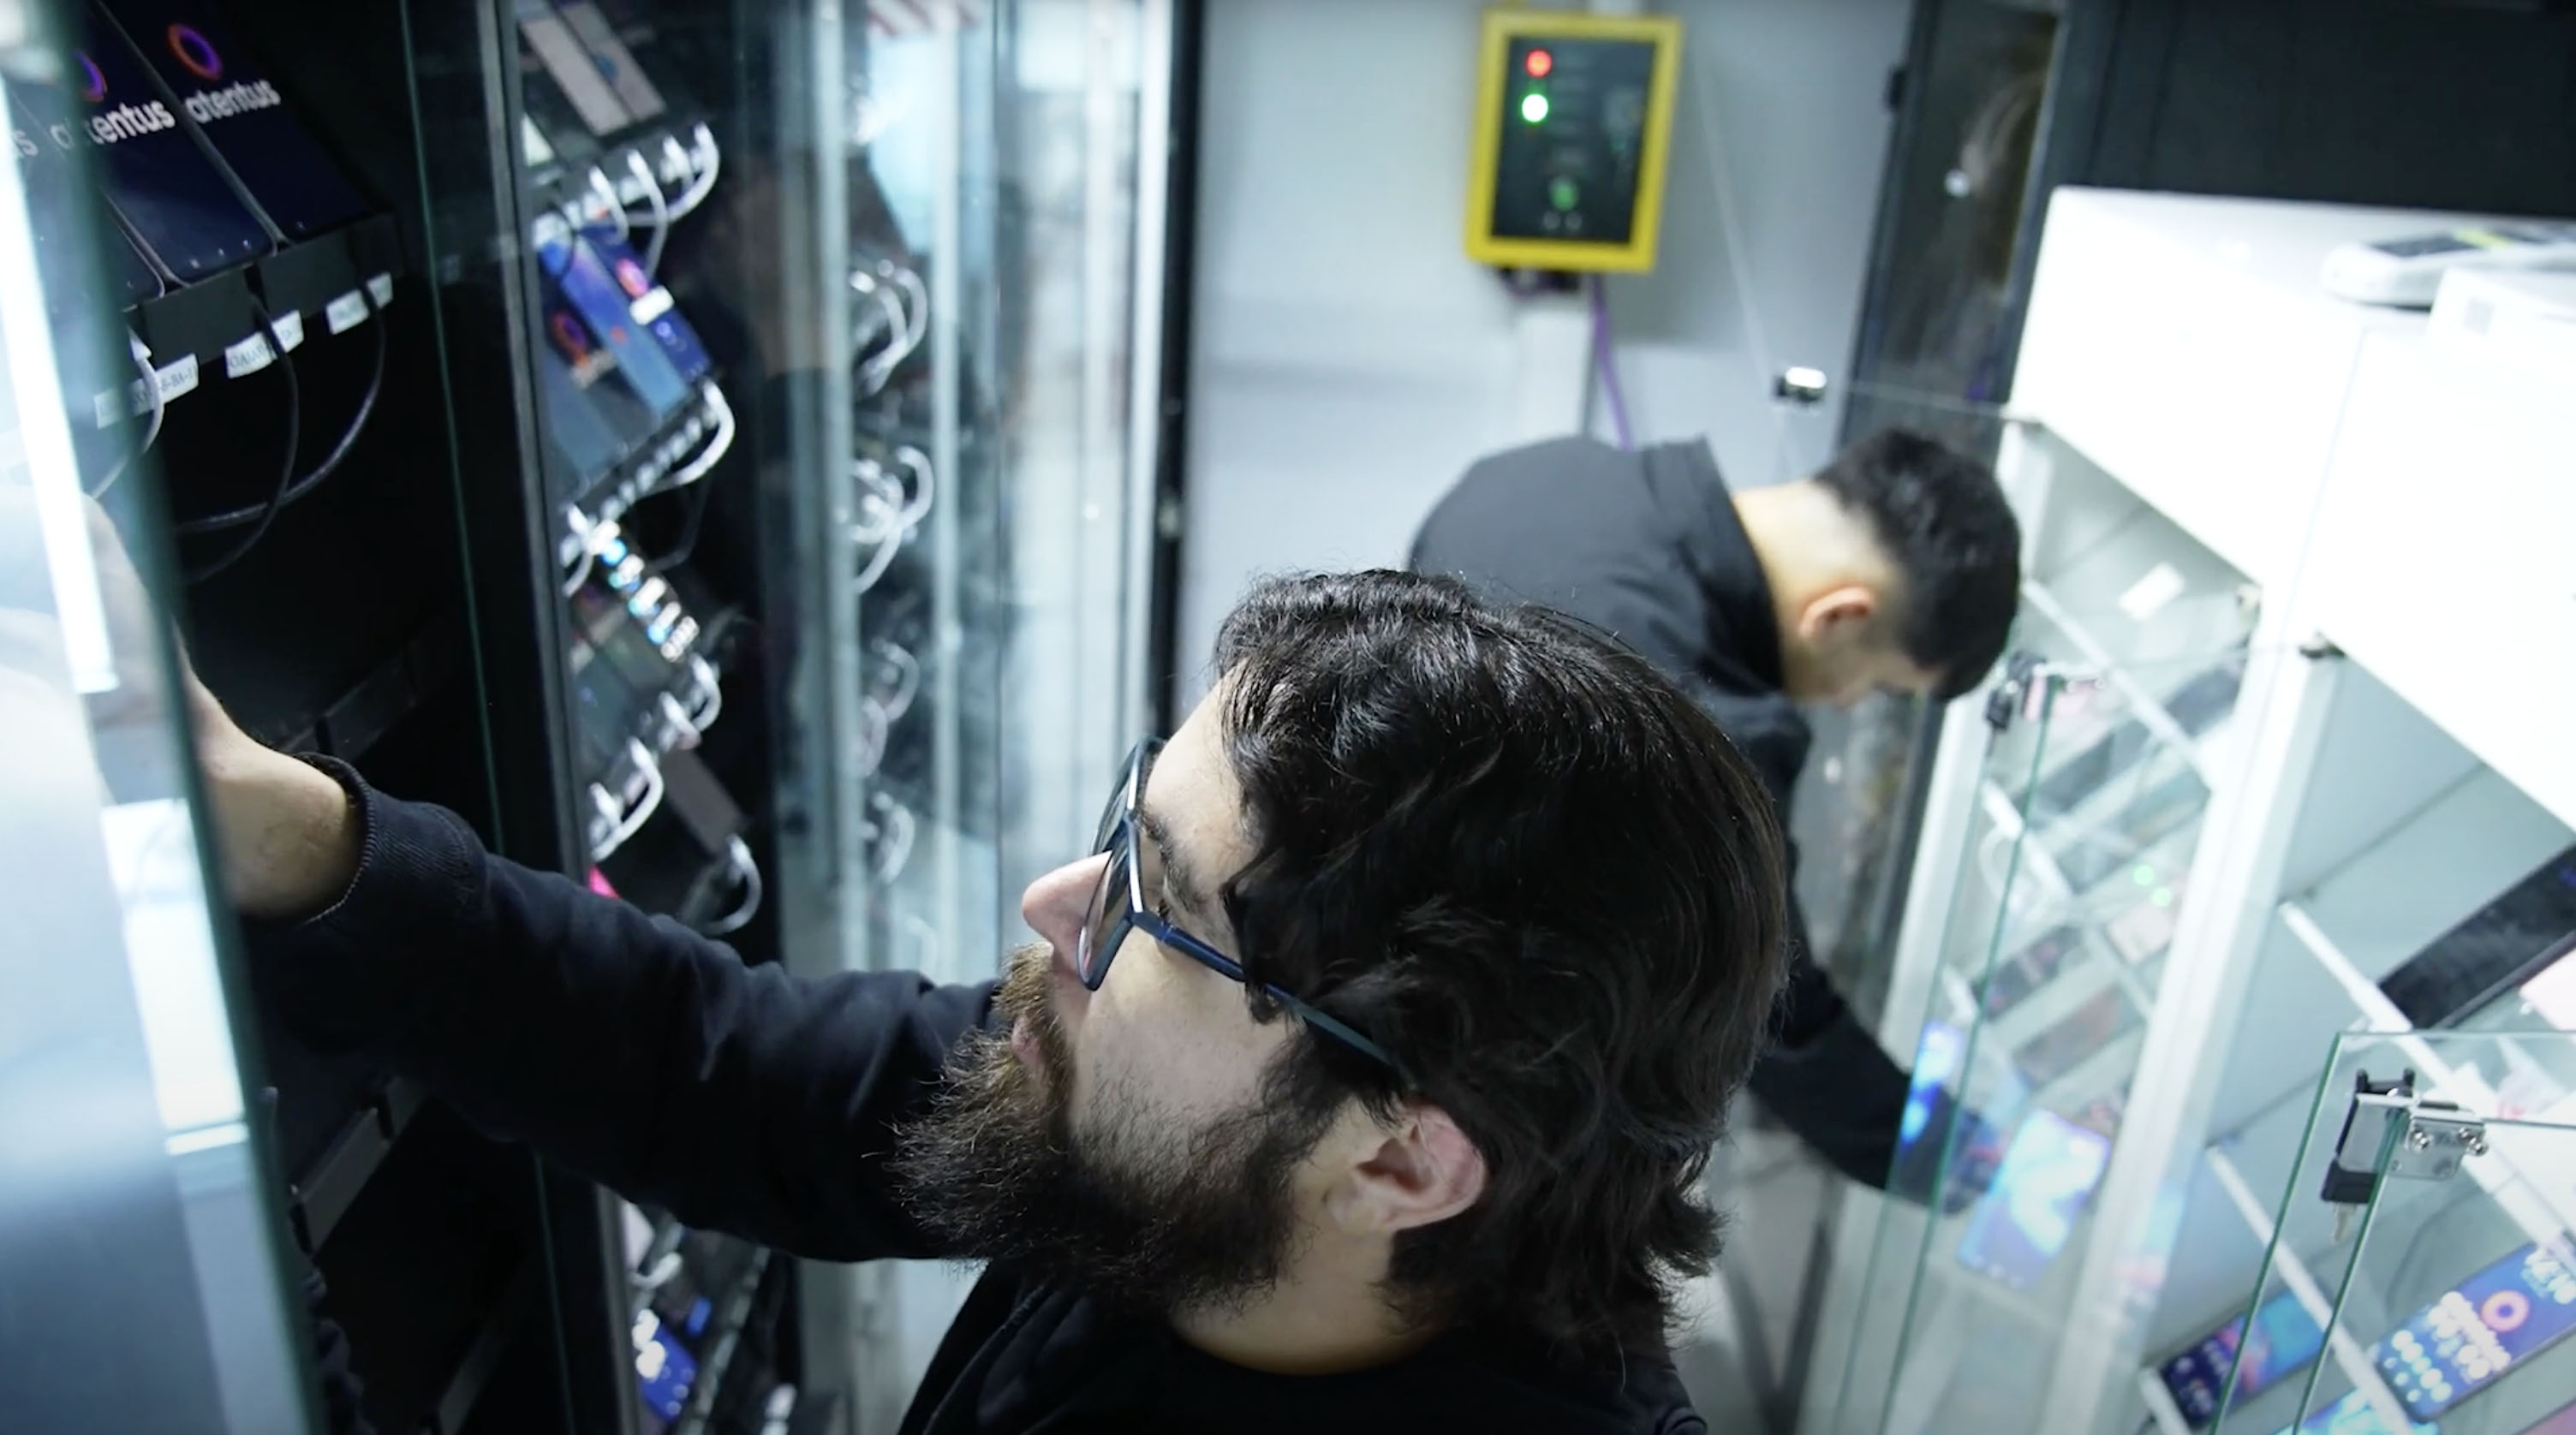
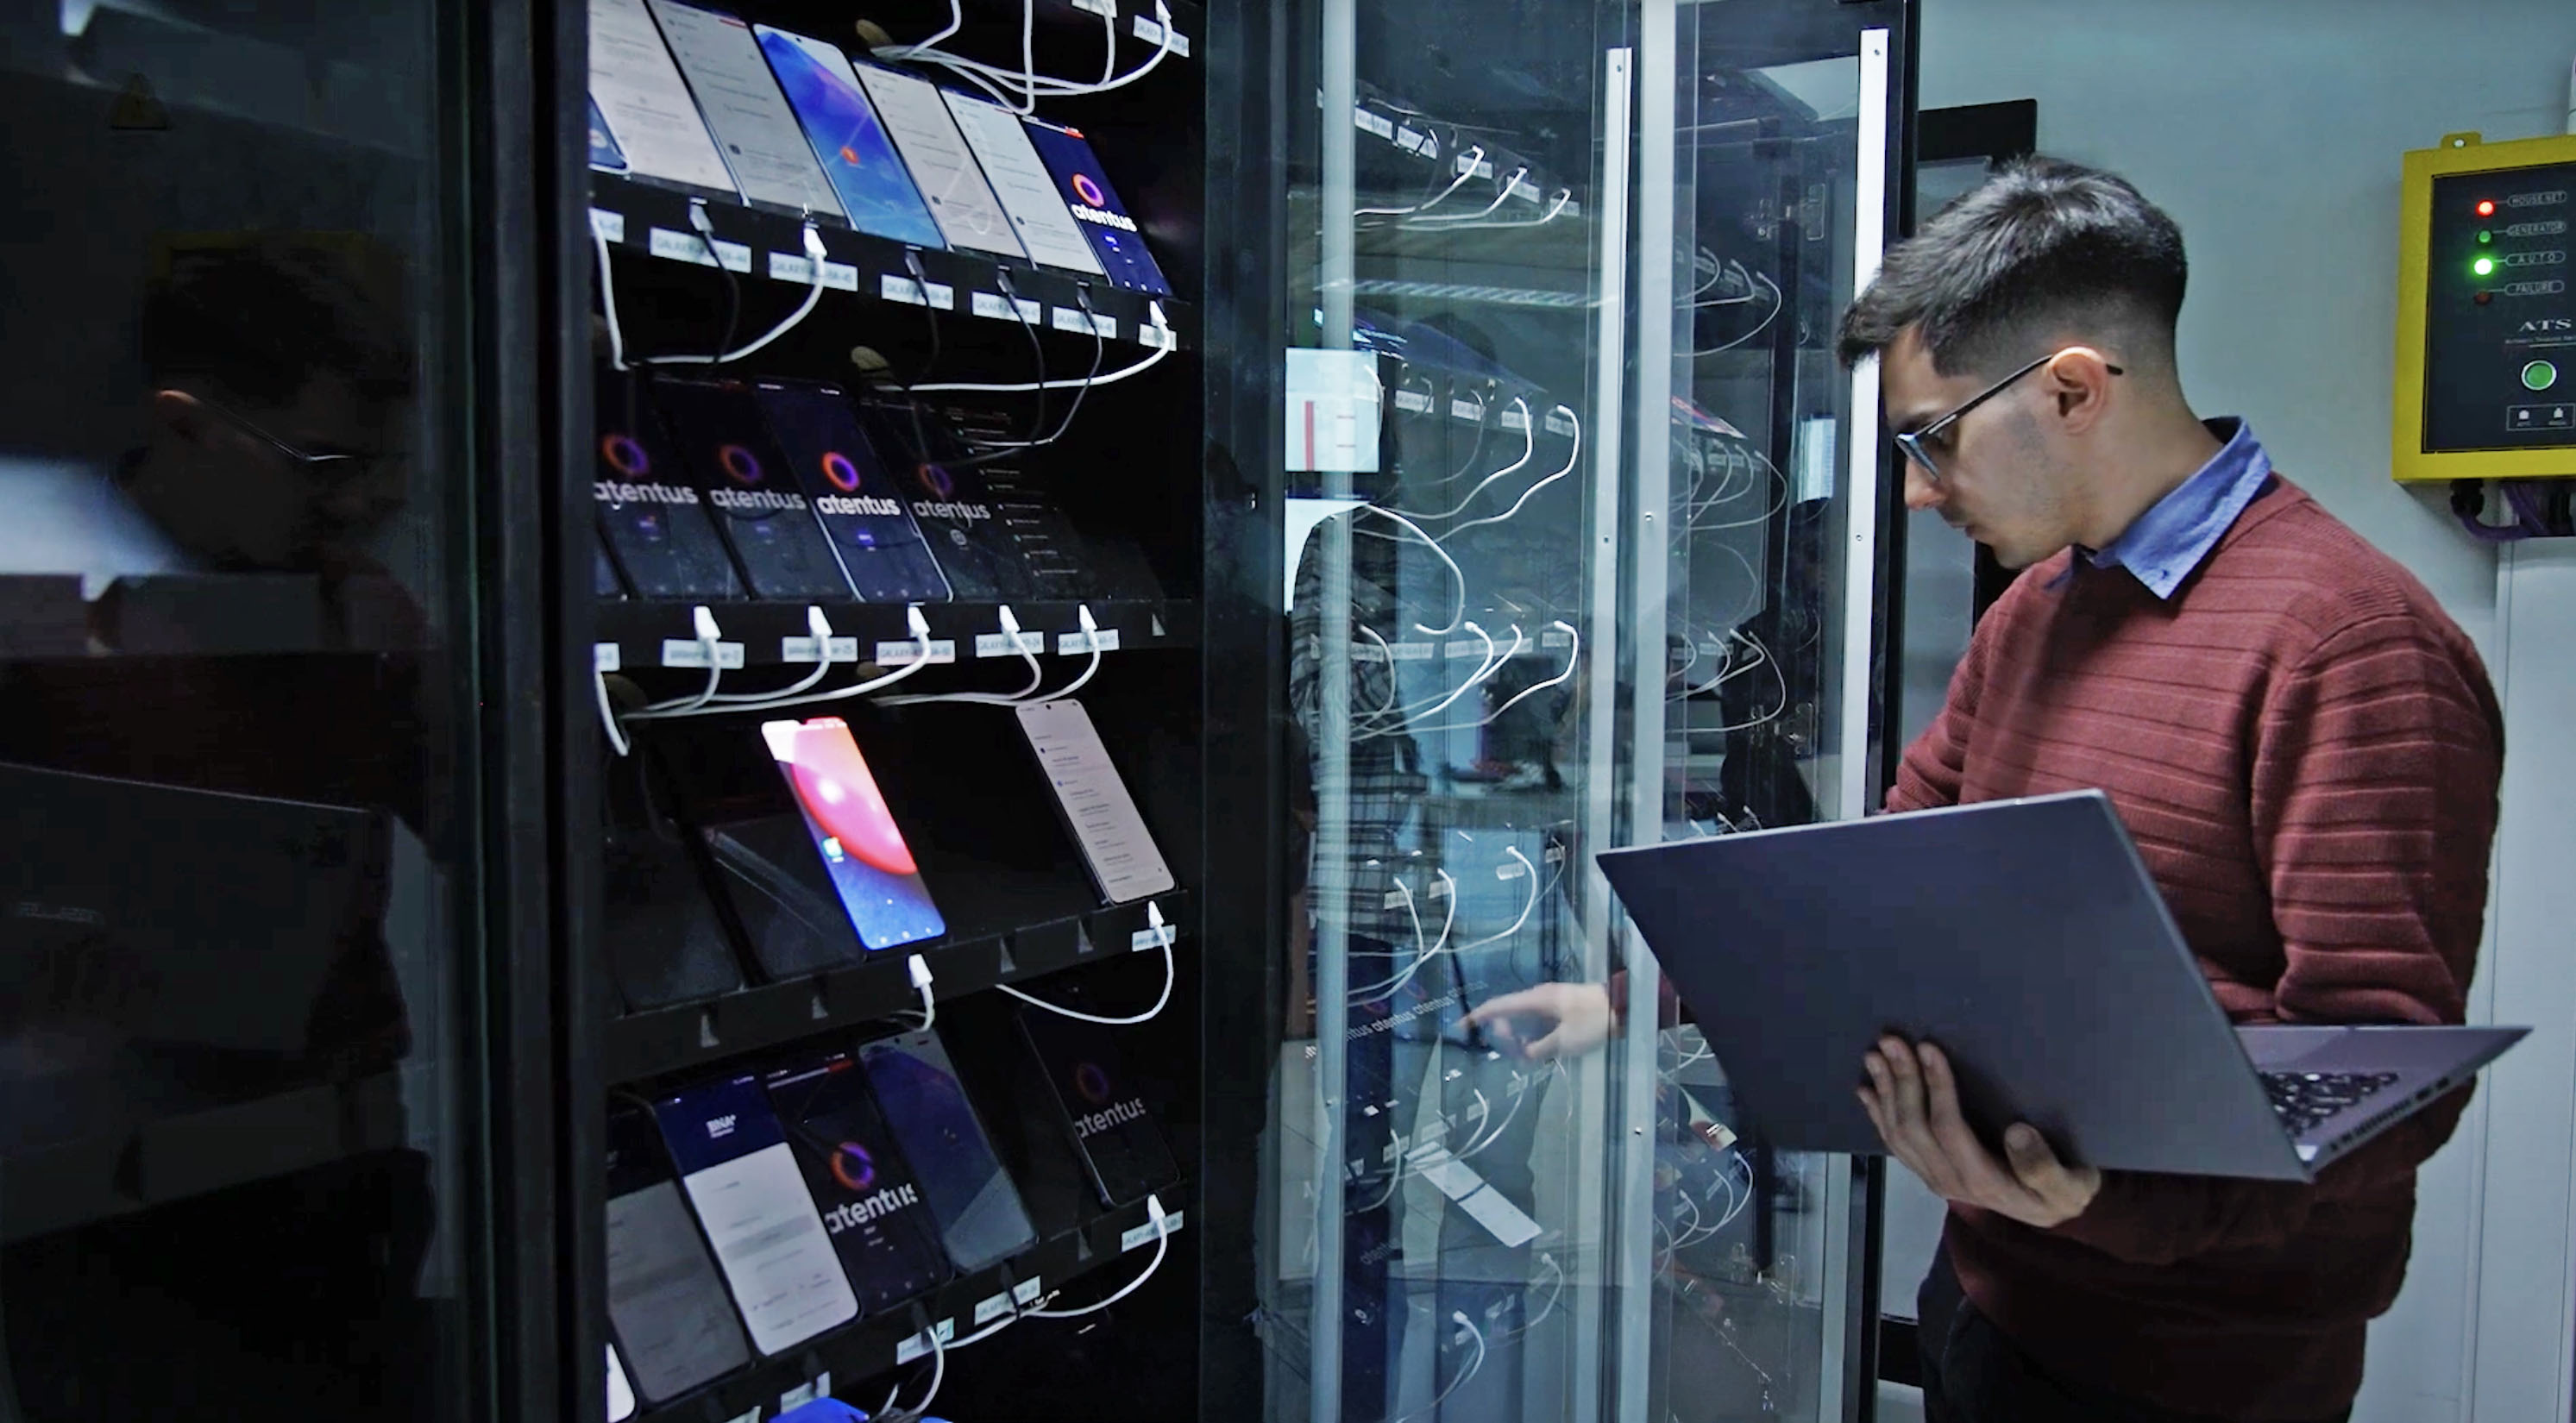
The Atentus team has developed a series of Atentus integrations-Dynatrace for customers, where Synthetic monitoring data, which are born from Atentus's own technology and method, are used to take advantage of Dynatrace's dashboard and analytics engine deployment capabilities.
This has allowed Atentus customers who use Dynatrace platforms to enrich their visibility into the operation of their applications, taking User Experience (UX) as a fundamental basis for their metrics and decision-making.
This is possible through the deployment and analysis of data on a time axis and incident detection with high accuracy.
Along with this, the unique methodology of Atentus monitoring makes it possible to separate external or Internet factors, which affect the deployment experienced by users, from internal factors or software and hardware infrastructure that come from the applications. For these cases, Atentus-Dynatrace data analysis provides a quick and accurate view of what is happening within the applications. For this purpose, views and dashboards are designed that combine Atentus Synthetic Monitoring and APM Dynatrace
Dynatrace is used to create higher-quality software faster, update and automate business operations in the cloud. It also provides your customers with the best possible digital experiences.
Each page of the application they generate uses a JavaScript tag that Dynatrace OneAgent injects into the HTML for actual user monitoring. With these tags in place, the agent can control how quickly and effectively their clients' browsers on mobile and desktop devices respond to requests.
In the application performance management product category, Dynatrace has been recognized as a leader (APM). The benefits of Dynatrace's all-in-one platform, which was designed for IT, DevOps and digital experience use cases and was based on a single data model to enable greater automation and intelligence, are reflected in these customer evaluations.
A software intelligence monitoring platform called Dynatrace facilitates digital transformation by alleviating the complexity of configuring the enterprise cloud.


%20vs%20Monitoreo%20Sint%C3%A9tico.avif)